T-Th 9:05 or 11:15
in Kimball B11
CS 1110: Introduction to Computing Using Python
Spring 2013
About:
Announcements
Staff
Consultants
Times & Places
Syllabus
Materials:
Texts
Python/Komodo
Command Shell
Terminology
Handouts:
Lectures
Assignments
Labs
Assessment:
Grading
Exams
Resources:
CMS
Piazza (link)
Piazza (about)
VideoNote
AEWs
FAQ
Python Library
Online Python Tutor
Style Guide
Academic Integrity
Authors of these pages: D. Gries, L. Lee, S. Marschner, & W. White, over the years
Assignment 2:
Call Frames
Due IN CLASS on Thursday, February 21st
These instructions last updated on February 25 2014 05:44.
Any changes from the handout marked in orange.
Feb 21 11:35am: Clarification on other crossed out frames in part 3.2(see Piazza @100)
Feb 26-27: solutions posted, remark about the Online Python Tutor added
Authors: W. White, L. Lee, S. Marschner
This is a simple written assignment where you are going to diagram a few call frames. It should not take more than 15-20 minutes do to this assignment. So even if you are busy revising assignment 1, you should be able to do this assignment (as) well.
The solution to the assignment is here. In going over the solutions and our comments, you may find it useful to consult the Online Python Tutor.
“Diagramming” is what we do in the lecture notes where we draw frames to represent function calls and folders to represent the objects. These are a way of giving us a visual representation of what is going on in the computer when it runs Python. The purpose of this assignment is to solidify your understanding of how function calls work.
Before You Get Started
Grading Policy
The revise-and-resubmit cycle was only for the previous assignment. This assignment will receive a single grade, and there will be no revisions. So you should try to get it right the first time. With that said, this assignment is meant to be fairly straightforward. If you are having trouble, please consult someone for help.
Collaboration Policy
You may do this assignment with one other person. If you are going to work together, then form your group on CMS as soon as possible. This must be completed before you submit the assignment, even though you are handing in on paper. It takes actions on CMS from both people to form the group. The first person proposes, and then the other accepts. You do not need to have the same partner as last time; you can change your partner with each assignment.
If you do this assignment with another person, you must work together. It is against the rules for one person to to fill out this assignment and just have the other person put their name at it. You must actively collaborate on this assignment.
You may not collaborate with anyone other than your CMS-registered partner.
Getting Help
If you do not know where to start, if you do not understand how function calls work, or if you feel completely lost, please talk to someone immediately. This could be one of the course instructors, a TA, or a consultant. Do not wait until the last minute! See the staff page for more information.
Diagramming Conventions
Most of our diagramming conventions follow the lecture notes. However, just to be safe, we will make our conventions explicit here.
Diagramming Variables
A diagram for a variable should include the variable name and a box for the value. Old values are crossed out when they are replaced by new ones.
![]()
![]()
Diagramming Objects
All values in Python are objects, but
we only bother to draw an object separately from variables referring to it
if the object is mutable;
that is, the contents of the folder can be changed.
Values of immutable objects, including objects of the
built-in types of int,
float, bool, and str, are simply drawn
inside variables.
So far the only mutable objects we have seen are those with named attributes, like those of type Point.
You will not be responsible for figuring out how to diagram an object in this assignment; for any mutable object, for which a folder is necessary, we will show you how to diagram it. When you diagram an object you should obey the following conventions:
-
The folder's identifier (ID, or true name) should be unique and go on the folder tab.
-
The type of the object should go at the top right of the folder.
-
The attributes should be listed inside the folder and diagrammed just like variables.
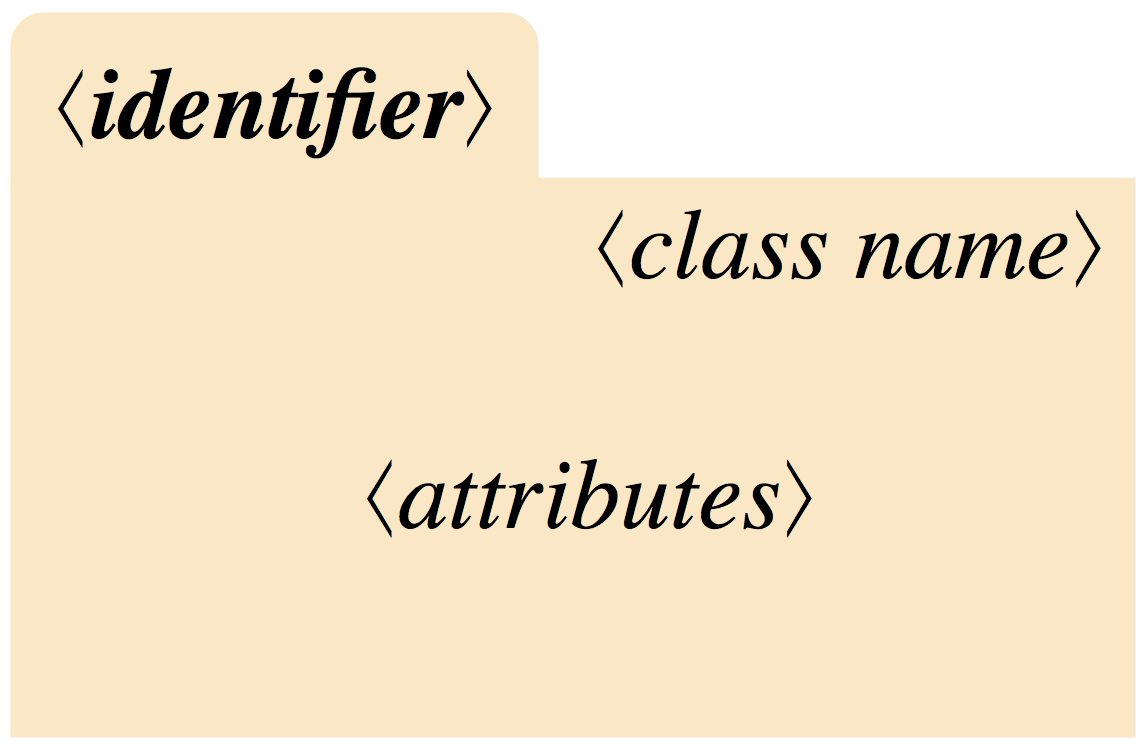
For example, a folder for an object of the type Point from
Lab 3 might look like this:

Diagramming Call Frames
Call frames are the way we diagram the temporary workspace where the variables used during a call to a function are stored.
Diagrams of frames should obey the following conventions:
- The top left corner is a box with the function name, a colon, and the program counter. The program counter indicates the next line of code to be executed in the function. (The first line of code after the function header corresponds to a counter value of 1.)
- When it is relevant, the module in which the function is defined goes in the top right corner of the frame. In this assignment there is only one module, so you don't need to include the module name.
- Local variables and parameters are diagrammed in the frame body; we do not distinguish between them.
- Local variables are not diagrammed until the assignment statements that create them are executed.

See the lecture notes for more details on how to create a call frame. In order to help you with the program counter, we will always number the lines of code for you. For example, suppose we have the procedure
  def print_name(last, first):
1      print "Hello "+first+" "+last+"!"
If we execute the call print_name("Carroll","Lewis"), then the call frame
starts out as follows:
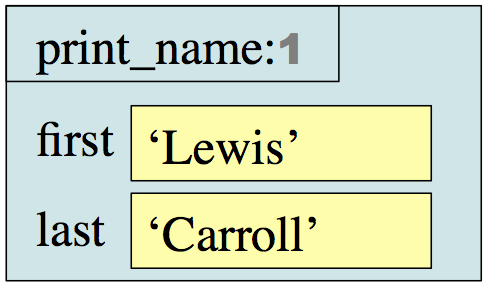
That is the state of the call frame when the function just starts, before it executes line 1 (remember, the instruction counter is the next line). After we execute line 1, the call frame is as follows:
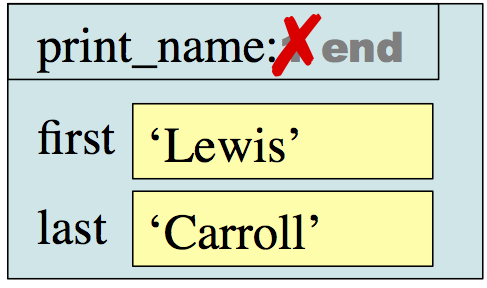
Note the instruction counter now reads “end;” that is because there are no more instructions to execute (it's also fine to leave it blank to indicate the same thing). Also note that we crossed off the old value rather than erasing it, so we can see the history of values it has had in the past by looking at the final diagram. After the function completes, the diagram will show the frame (neatly) crossed out, since it no longer exists after the call.
Assignment Instructions
In this assignment you will diagram the execution of three different function calls. We want you to show us what is on your paper at the end of the execution, including values of variables and frames for calls that have been crossed off. Both the final values and the crossed-off values or sequences of values (for program counters, for instance) are part of what we will grade, so please cross off neatly so that we can read what was there before!
Function min(x,y)
The function min is built into Python. However, if we were to write
it ourselves, it might look like this:
   def min(x,y):
       """Returns: min of a and b"""
1      minimum = x
2      if (y < x):
3          minimum = y
4      return minimum
Diagram the execution of the statement c = min(1,2)
Diagram the execution of the statement c = min(1,2).
You will need to
draw the global variable c and a call frame. When you are done
your diagram will show what variables existed in the frame, what values they
had, and which lines were executed.
Whenever an assignment changes the value of an existing variable, cross out the old value in the box and write the new value in the box. When you are done, the program counter will read “end” (or, equivalently, blank) and there will be some crossed-out line numbers indicating which lines were executed.
Diagram the execution of the statement d = min(y,x)
Now suppose that you have the following (global) variables:
![]()
As we said in class, these variables are not the same as the
parameters of min, which are local to that function.
Repeat the previous exercise for the statement d = min(y,x).
Function rot_x(q)
The function rot_x(q) is a variation on
Lab 3.
It takes a point as input and swaps the y and z attributes; the
x attribute is left unaltered. (This is a rotation around the
x axis.) We define this function as follows:
   def rot_x(q):
       """Swap the y and z attributes of q

       Example: The point (1,2,3) becomes (1,3,2)

       Precondition: q is (refers to, contains the ID of) a point object"""
1      tmp = q.y
2      q.y = q.z
3      q.z = tmp
Diagram the Call rot_x(p)
When dealing with mutable objects, remember: it's important that a variable does not contain an object; it can only hold the ID of the object. Since Point is mutable, the assignments
  p = Point(1,2,3)
  q = Point(4,5,6)
would produce the following situation:

In this case we have folders representing two Point objects, and two variables storing these objects' IDs.
Diagram the call
rot_x(p) given the global variables shown above.
Include the global variables p and q and the objects
they refer to, as well as any other variables and objects that are created,
in your diagram. Your answer for this problem will include the frame for the call to rot_x,
some global variables, and some object folders, all marked up to show the values at the
end of execution, as well as anyother (crossed out) frames and values that existed during
execution.
Turning in the Assignment
When you finish the assignment, put your name and netid at the top of the page. Otherwise, we will not know that the assignment is yours, and we cannot give you credit for your work. If you are working with a partner, then the partner's name must be on the assignment as well. In addition, to help us out with organization, please underline your last name(s). Do not underline your first name(s).
Bring the assignment to class on the day it is due: Thursday, February 21st to hand it in. We will start grading this immediately, so please make sure the assignment is turned in on time.