CS 6670 Computer Vision (Spring 2011)
Project 1: Feature Detection and Matching
Quick Link: Description
Design Choices
Performance
Discussion
My Results
Extra Credit
Description
In this project, I implemented Harris Corner detection, MOPS descriptor and simplified version SIFT descriptor. For extra credit, a kd-tree based near neighbor search is implemented using ANN library.
Design Choices
Harris:
- Threshold for harris operator: 0.1
- Extract harris corners and orientation of corners
- Convert the original image to grayscale image
- Run sobel filter 3 × 3 in both x and y directions
- Compute Ixy using Ix and Iy
- Perform Gaussian blur on Ix, Iy and Ixy
- For each point in the original image, compute harrsi matrix H
- Compute harris value by det(H)/tr(H)
- Compute orientation using atan2
- For each point p in the image, if it's harris value is greater than the threshold and it's the maximum among a 3 × 3 window, output that point as a corner
Simple descriptor:
- For each corner, take pixels in 5 × 5 window and convert them to a 25 dimensional vector as descriptor.
MOPS descriptor:
- For each corner, take pixels 41 × 41 window
- Rotate the window according to the orientation of that corner
- Run Gaussian blur on the window
- Downsample the window to 8 × 8, and conver it to a 64 dimensional vector as descriptor
SimpleSIFT descriptor:
- For each corner, take pixels 16 × 16 window
- Rotate the window according to the orientation of that corner
- Run Gaussian blur on the window, where the kernel size is 7 × 7
- Compute gradient for each point in the window
- For each 4 × 4 window, compute histogram for angles
- Concatenate the histograms to form a 128 dimensional vector as descriptor
Performance
- Plots of ROC Curves
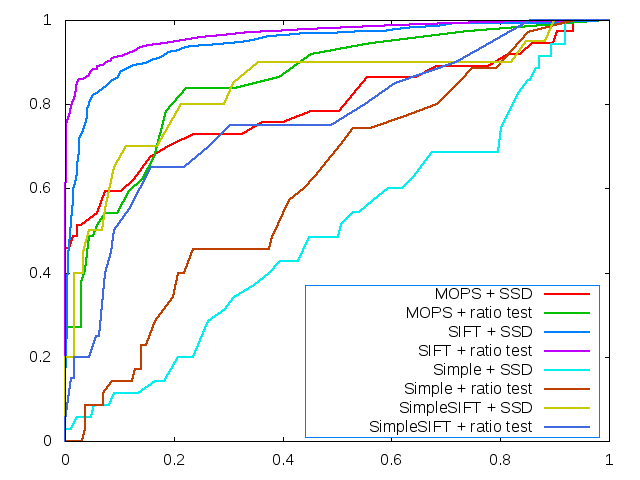
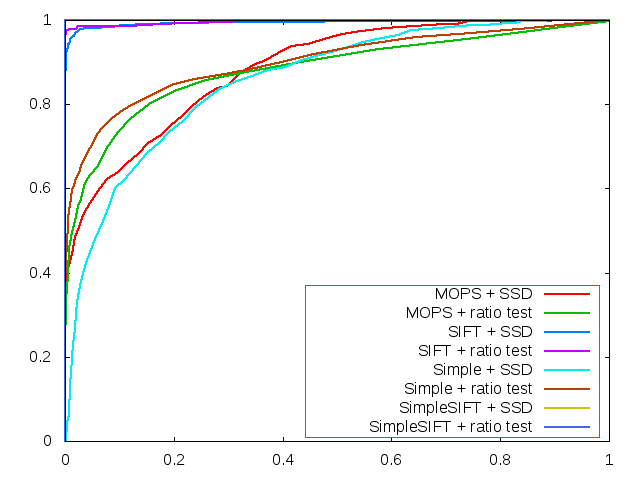
Left image shows a plot of 6 curves for graf while the other shows a plot of 6 curves of yosemite. Note that for yosemite, SimpleSIFT+SSD and SimpleSIFT+ratio test are overlapped.
- Plots of Threshold Curves
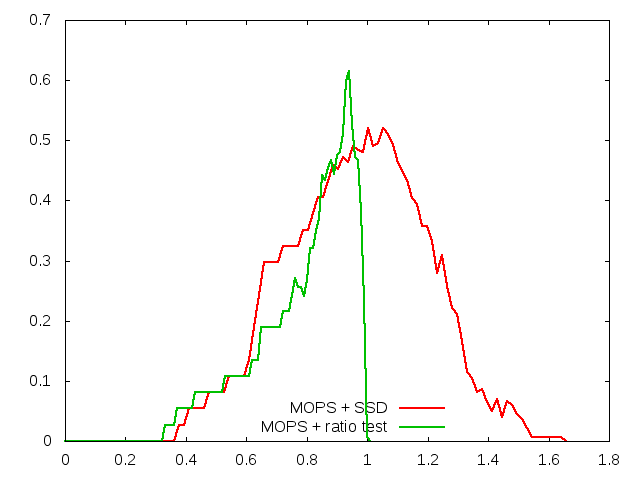
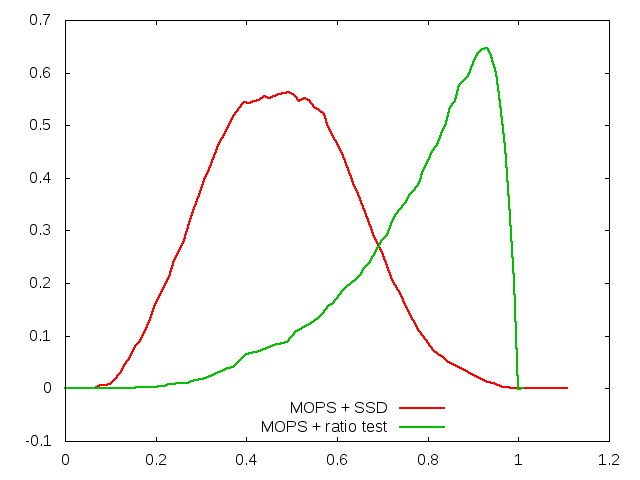
Left image shows threshold plot for graf and right image shows threshold plot for yosemite, on mops.
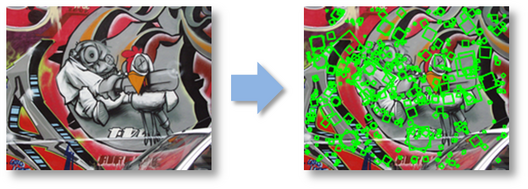
- Images of Harris Operator

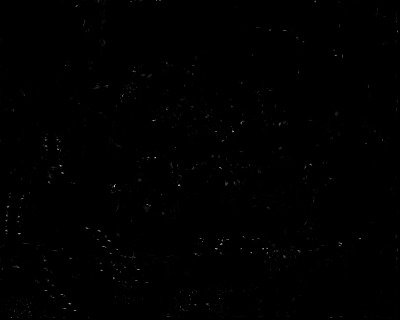
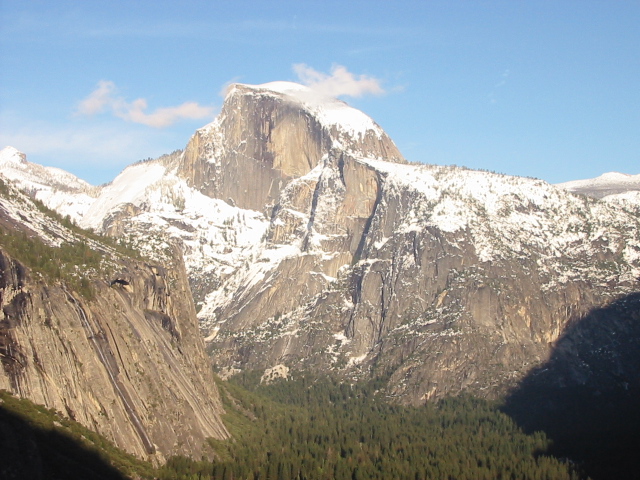
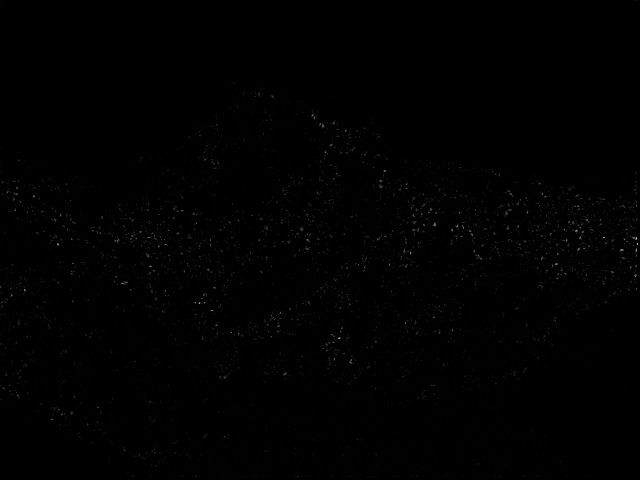
- Average AUC
|
Graf |
Leuven |
Bikes |
Wall |
| MOPS + SSD |
0.655 |
0.620 |
0.511 |
0.700 |
| MOPS + Ratio Test |
0.612 |
0.558 |
0.597 |
0.544 |
| SimpleSIFT + SSD |
0.552 |
0.613 |
0.568 |
0.573 |
| SimpleSIFT + Ratio Test |
0.522 |
0.620 |
0.551 |
0.660 |
| Simple + SSD |
0.462 |
0.420 |
0.304 |
0.649 |
| Simple + Ratio Test |
0.558 |
0.531 |
0.489 |
0.580 |
Discussion
MOPS:
- Strengths
- It is robust to rotation
- It is robust to translation
- Weaknesses
SimpleSIFT:
- Strengths
- It is robust to rotation
- It is robust to translation
- Only the angles are used as feature, can be robust to different exposure in some cases
- Weaknesses
My Results


Extra Credits
- I implemented a fast ratio test using ANN library.


