Project2
Spencer Jackson (saj53), Sarah Nguyen (smn64)
Design Decisions
We created a class
called HarrisMatrix. Given (x,y) coordinates and the contents of a Harris
matrix, A, B, and C, the constructor for this class can compute the
trace and determinate. This was a convenient way to store all the data
we need to compute canonical orientations.
We stored these HarrisMatrix classes in a CImageOf, and
passed this CImage to another function, computeLocalMaxima(), that returns a
queue of the HarrisMatrix classes for pixels locating at local maxima.
Performance
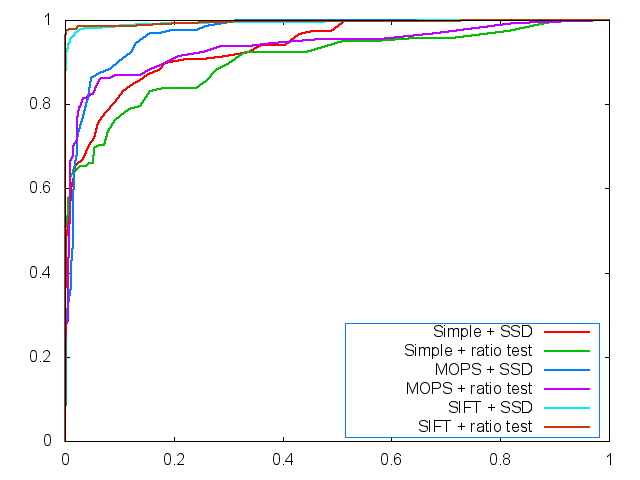
ROC Curves for Yosemite
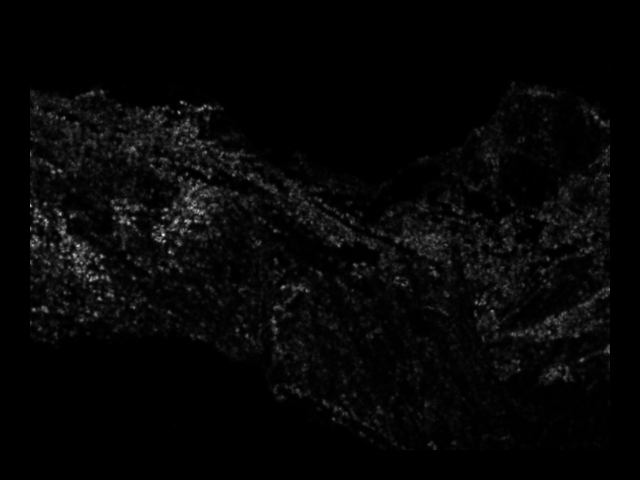
Harris operator image for Yosemite
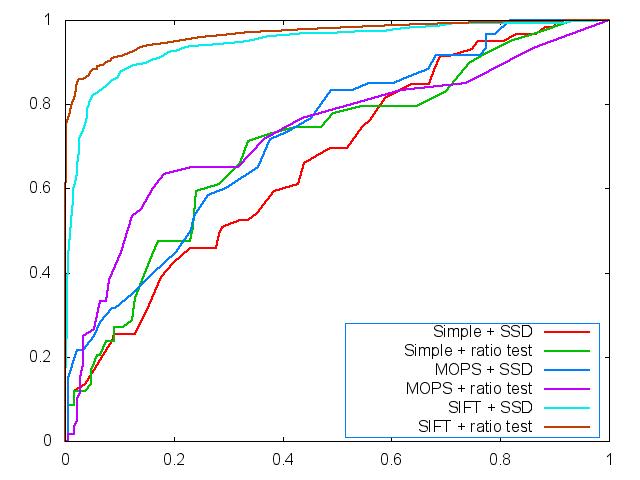
ROC Curve for Graf
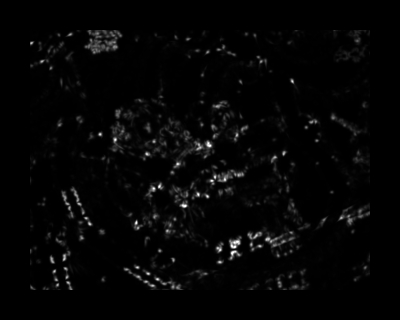
Harris operator image for Graf
Average AUC for feature detecting
Average AUC for Leuven
- Simple 5x5 Window Descriptor + SSD: 0.389038
- Simple 5x5 Window Descriptor + Ratio: 0.519435
- MOPS Descriptor + SSD: 0.663786
- MOPS Descriptor + Ratio: 0.642164
Average AUC for Bikes
Unfortunately, our code segfaults when running benchmark on this set of
images. Below are the AUCs for comparions between img1 and img2.
- Simple 5x5 Window Descriptor + SSD: 0.789779
- Simple 5x5 Window Descriptor + Ratio: 0.734321
- MOPS Descriptor + SSD: 0.984611
- MOPS Descriptor + Ratio: 0.987805
Average AUC for Wall
- Simple 5x5 Window Descriptor + SSD: 0.483977
- Simple 5x5 Window Descriptor + Ratio: 0.588421
- MOPS Descriptor + SSD: 0.639456
- MOPS Descriptor + Ratio: 0.651109
Strengths and Weaknesses
Our feature comparison works only fairly well for the img1 and img2 in Graf (AUC in the low 70s), which is a slight
viewpoint shift. In terms of average AUCs for the three benchmark sets, our solution performs rather poorly, the highest in the mid 60s. It's possible that the way we implemented and dealt with feature orientations is incorrect and that caused the poor performanc.
For Leuven, MOPS improves performance significantly from the simple descriptor, perhaps because the pictures different only with regards to intensity shift, and the MOPS descriptor intensity normalizes its features.
The bikes benchmark set also shows a significant jump between MOPS and the simple descriptor. Each bikes image is blurrier than the other. MOPS applies a Gaussian blur for its features, so perhaps the Gaussian blur makes the descriptor more resistant to changes in sharpness.
The wall benchmark set improves accuracy when ratio comparison is used instead of just SSD. This makes sense since the bricks in the image create many similar looking features.