Project 2: Features
[By Pakawat
Phalitnonkiat (pp287) and Rina Tse (rt297)]
Design and Performance
The
performance is quite good but not good as SIFT. We have implemented the
function to compute Harris score by filtering the image to find gradients in x-
and y-axes. Then we put them in the Harris matrix H and compute the maximum
eigenvalue and corresponding eigenvector. However, the eigenvector direction
could be defined in 2 ways. We use arctan to find the angle of the eigenvector
but the arctan range is [-pi/2, pi/2], so we have an option to add it with pi
if the gradient in x direction is negative. So, we ended up with the
eigenvector with direction pointing to the brighter area.
We
only collect about top 2% of the Harris scores to be features. That is, we set
the threshold to be at z-score of 2.05 and normalized all the features. This
turns out to be a good idea since we don't have to worry about the size of the
images which could produce too many features and take more time to compute.
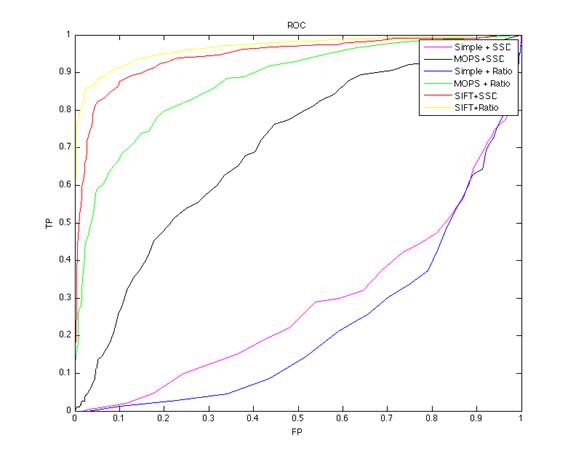
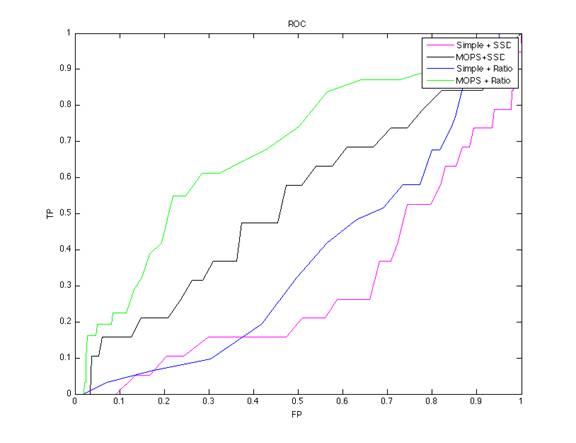
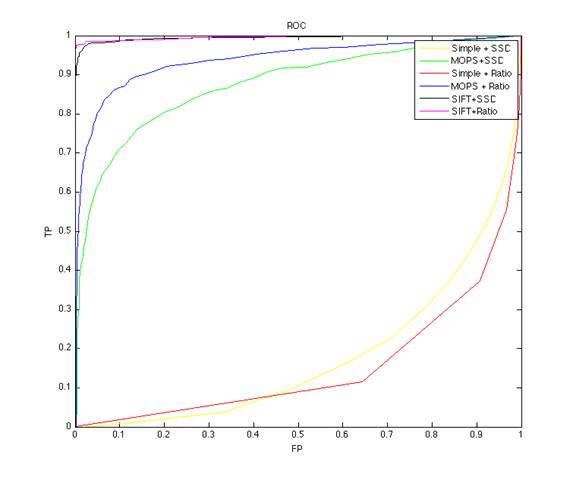
1. ROC
1.1 Graf
·
ROC of graf1 vs
graf2
·
ROC of graf1 vs graf4 (NOTE: no sift results provided)
1.2. Yosemite
·
ROC of Yosemite
1 and 2.
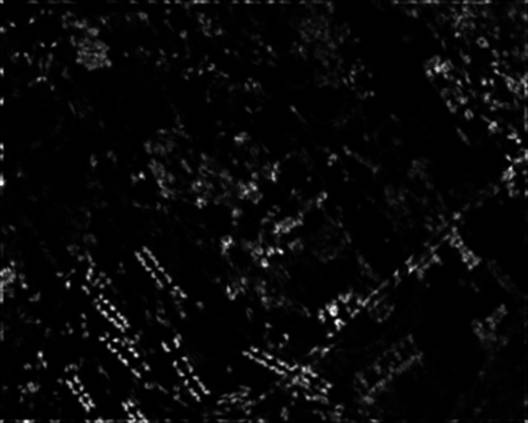
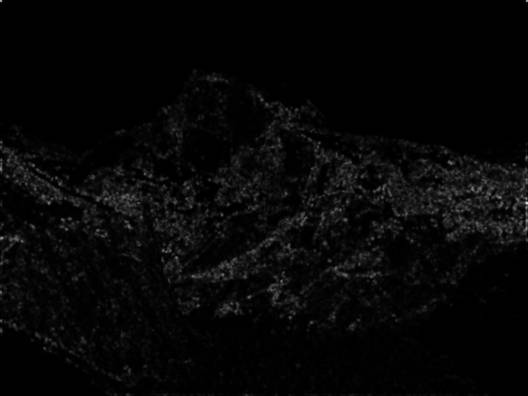
2. Images of Harris operator on Graf and Yosemite
Graf:
·
Graf1
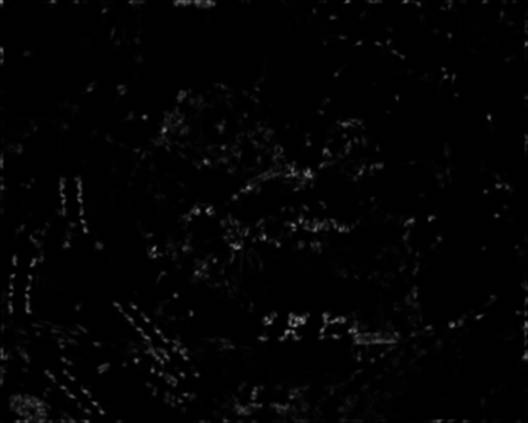
·
Graf2
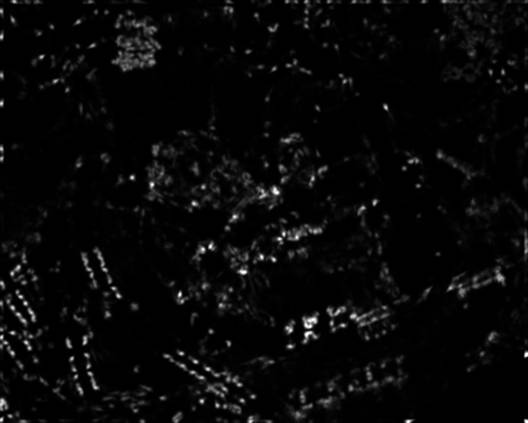
·
Graf4
Yosemite:
·
Yosemite 1
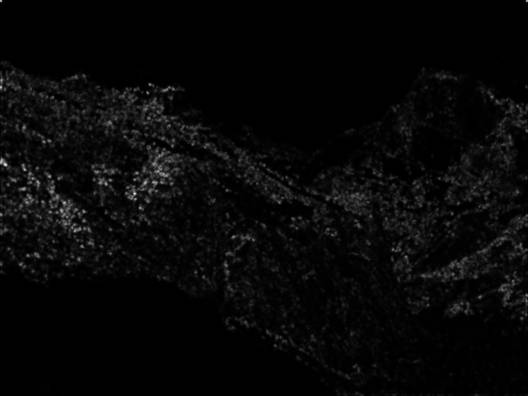
·
Yosemite 2
3.
AUC
|
Descriptor |
Matcher |
Bikes |
Wall |
Leuven |
Graf |
Yosemite |
|
Simple |
SSD |
0.691 |
0.557 |
0.594 |
0.289901 |
0.179564 |
|
Simple |
Ratio |
0.529 |
0.607 |
0.581 |
0.615195 |
0.875559 |
|
MOPS |
SSD |
0.233 |
0.250 |
0.265 |
0.301343 |
0.152834 |
|
MOPS |
Ratio |
0.890 |
0.750 |
0.796 |
0.775898 |
0.937792 |
|
|
Average |
0.566 |
0.541 |
0.559 |
0.495584 |
0.5364373 |
Strengths & Weaknesses
Strength:
·
Harris score is
stable in most situations.
·
We also
implemented the Harris detector so that the threshold varies with the scale in
intensity of the image.
·
MOPS also
provides us the invariance in rotation and illumination.
Weakness:
·
The simple
descriptor is not invariant.
·
MOPS is still
not good enough at rotation.
·
The descriptors
we implemented are not good as SIFT.
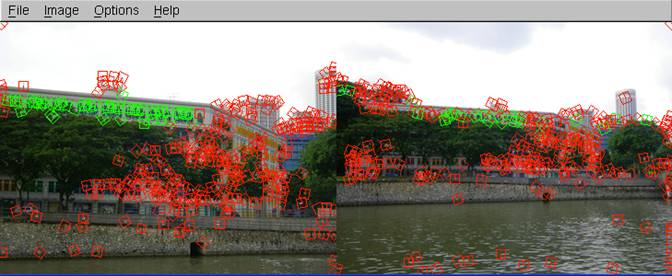
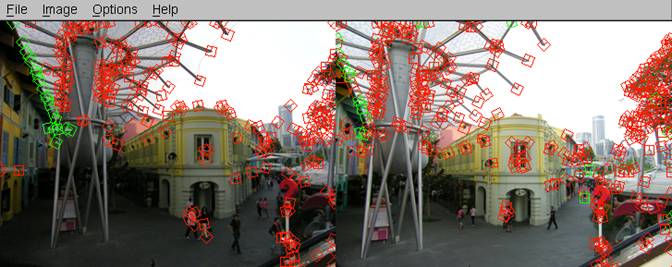
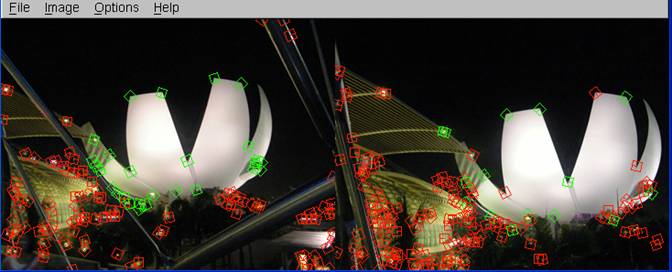
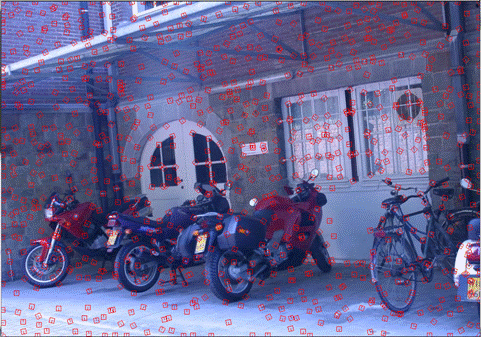
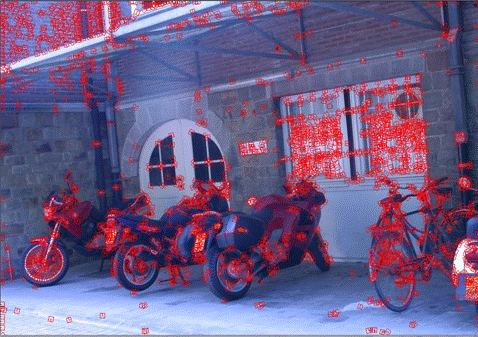
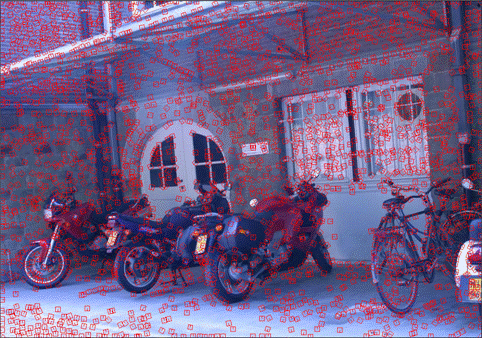
Other Images
We have used our own
images to test our program. Here are the results:
The results came out to
be desirable. It matches correctly about 75-90%.
·
Testing the
scaling images. Even though our descriptor is not scale invariant but it turned
out to good in this example.
·
Testing images
in different illumination.
·
Testing scaling
and rotating images.
Extra Credit Items
·
Adaptive Non-Maximal Suppression
This is
implemented in adaptiveSuppress() and can be enabled by calling it (uncomment
the line) in ComputeHarrisFeatures()
Parameters:
cRobust = 0.9 as suggested in the paper. Number of features nip as shown below:
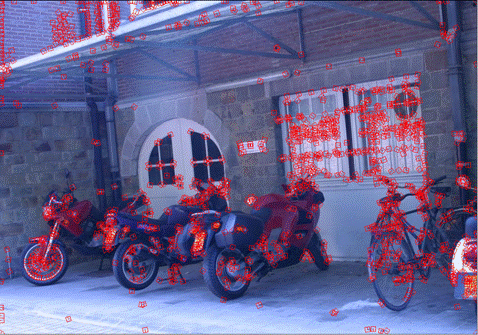
 ~900 features
 2236 features
Without Adaptive Non-Maximal
Suppression With Adaptive Non-Maximal Suppression
·
Alternative Matching score
We tried using (1-cosine
similarity) to measure the distance between two features instead of using the Euclidean
distance. It was found that the AUC results using (1-cosine similarity) improve
over the simple Euclidean distance results but do not improve over the ratio
test results.