Project 2
For feature detection, we decided to pass in the A, B, and C values from the harris matrix through our function call using bands 1, 2, and 3 (which are unused for harris, as we convert to grey scale). This enabled us to calculate the eigenvalues and important eigenvector efficiently.
For feature description, we made two different methods. The simple detector was very straight foreward. We just took a feature and computed the 5x5 matrix around that feature and stored it as a length 25 vector. For MOPS, we first made a call to warpglobal to shift our original prefiltered image (NxM) to the origin and rotate it in the direction of the max-eigenvector. We then downsampled to a 41x41 sized image. Then, we scaled that image using a second call to wrapglobal and downsampled to our desired 8x8 descriptor. We computed the mean of the descriptor and subtracted it from each value in the descriptor. We then normalized the results.
For feature matching, we implemented the ratio test based on the code from the SSN distance. The only change we made was finding both the first and second best features. Then we used the formula given on the slides to determine the ratio-distance.
Using the ratio-distance produced better results than just the SSD distance. This is very apparent when looking at the MOPS ROC curves. Additionally, the MOPS descriptor performed noticeably better than our simple descriptor. This makes sense because the MOPS descriptor gives a much better description of a feature than the simple descriptor. However, the MOPS descriptor does take somewhat longer to run.
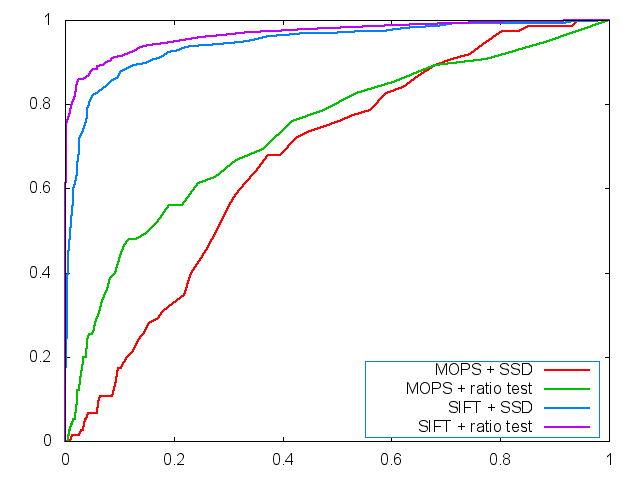
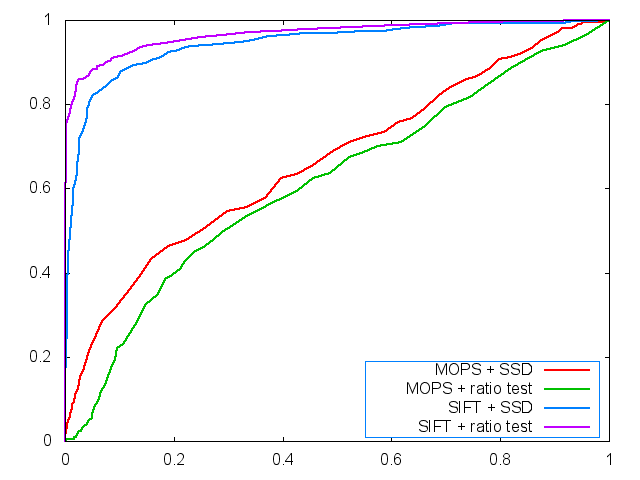
The AUC results for the four non-SIFT methods are as follows: Simple with SSD: 0.664503. Simple with Ratio: 0.613585. MOPS with SSD: 0.669208. MOPS with Ratio: 0.733608.
The average results for the pixel error and AUC for wall, leuven, and bikes is shown below:
BIKES:
2 1 1 // simple ssd
average error: 422.690681 pixels
average AUC: 0.268452
2 1 2 // simple ratio
average error: 422.690681 pixels
average AUC: 0.461339
2 2 1 // MOPS ssd
average error: 414.483221 pixels
average AUC: 0.619249
2 2 2 // MOPS ratio
average error: 414.483221 pixels
average AUC: 0.614591
LEUVEN:
2 1 1 // simple ssd
average error: 365.625691 pixels
average AUC: 0.216850
2 1 2 // simple ratio
average error: 365.625691 pixels
average AUC: 0.482755
2 2 1 // MOPS ssd
average error: 221.040530 pixels
average AUC: 0.595297
2 2 2 // MOPS ratio
average error: 221.040530 pixels
average AUC: 0.634804
WALL:
2 1 1 // simple ssd
average error: 422.690681 pixels
average AUC: 0.268452
2 1 2 // simple ratio
average error: 422.690681 pixels
average AUC: 0.268452
2 2 1 // MOPS ssd
average error: 422.690681 pixels
average AUC: 0.268452
2 2 2 // MOPS ratio
average error: 344.405514 pixels
average AUC: 0.587780