PA2 Webpage for John DeCorato and Nick McCarthy
Design Choices
The first major choice that we made was the decision to not prefiler the image and instead scale inside of our matrix for our reverse mapping function.
We did this because filtering the image would cause the edges of the features to blur, and make our results not as clear.
The second design decision we made changed ComputeHarrisValues so that we could return the rotation values in another image.
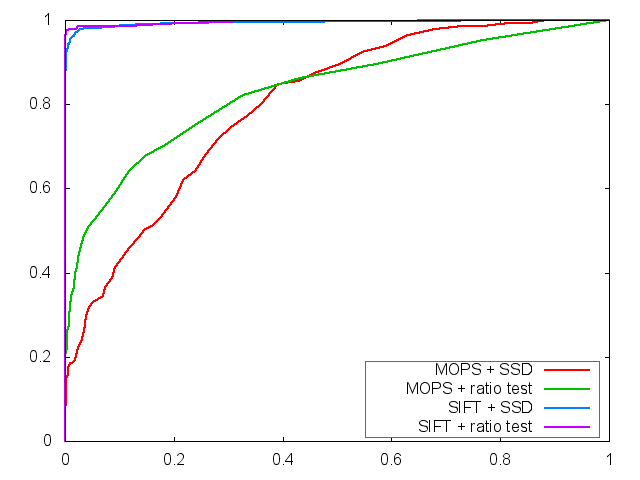
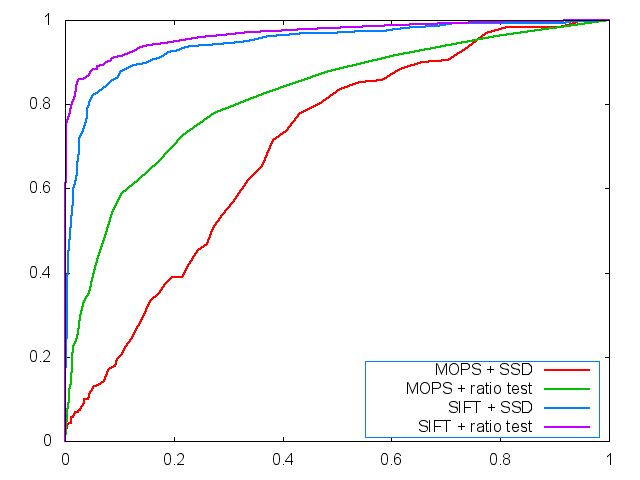
ROC Curves
Yosemite Curve:
Graf Curve:
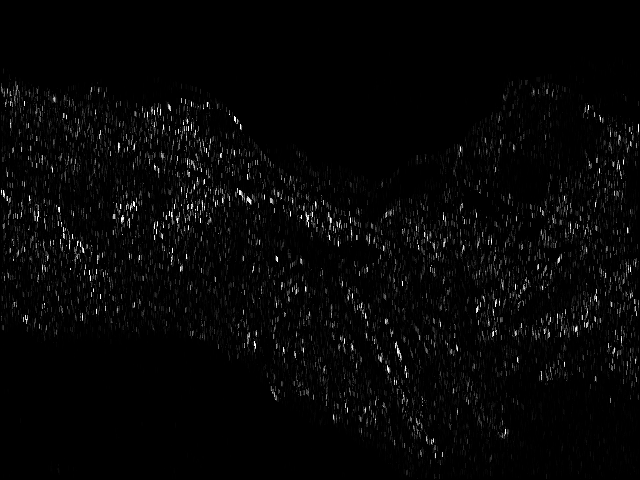
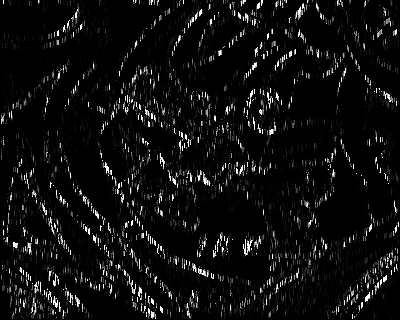
Harris Images
Yosemite
Graf
AUC Values
Graf: SSD with MOPS = 0.698247 | Ratio with MOPS = 0.818601
Yosemite: SSD with MOPS = 0.799832 | Ratio with MOPS = 0.832715
Strengths and Weaknesses
One weakness of the approach used for this assignment is the threshold value. If we set it too high, then in images without sharp edges due to blurring,
there will be few to no edges. If the threshold is too low, then it's possible for things that are not features to creep up in sharp images.
One way around this is to pass in a minimun number of features for the program to compute.
A strength of this approach is that it's quite accurate for sharp images.