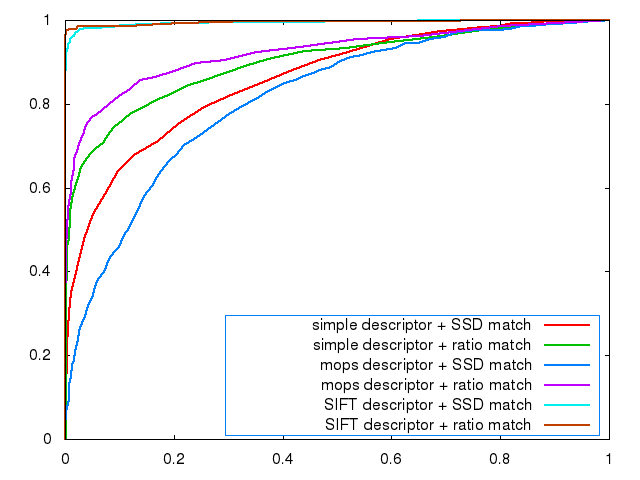
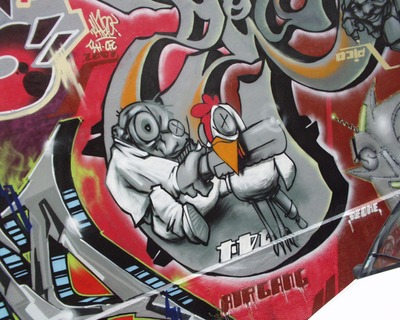
Curves for graf

For this project there wasn't a huge space of design choices to consider, since we were only required to fill out a few functions within the features.cpp file. We did in general opt to create helper functions for things like computing the Harris matrix around a point, computing the x or y derivative around a point, computing feature angles, etc. This allowed us to reduce overall duplication of code, making debugging easier.
We did have to make a few decisions on exact implementation details, particularly for computing harris scores and MOPS descriptors. Our Harris scores are computed by finding the Harris matrix around a given point, which requires finding the gradient at the point as well. We computed the gradient by taking an x and y derivative using the provided x and y Sobel kernels, and built the H matrix according to the formula given in the project description. After calculating the gradient, we chose the sign of the eigenvector on which we align the sample window based on which direction lay closest to the gradient. We chose a 5x5 gaussian kernel to use for weighting, again as in the description.
For our MOPS descriptors, we convert the input image to a grayscale and then apply a 5x5 gaussian blur using the Convolve function. This allows for more accurate subsampling later on. Then for each feature we compute a series of transformation matrices required to translate the feature to the origin, rotate and scale the image around the feature, and then translate the feature down by 4 pixels in each direction so that the target 8x8 window around the feature begins at the top left of the image. We then create an 8x8 destination image, and use WarpGlobal with the blurred grayscale as input and the inverse of the transform above so that the destination image recieves the correct MOPS descriptor. Next we compute the mean and variance and normalize the descriptor as specified in the project description, and copy the image data into the feature's data vector.
The ratio test implementation is very simple, in fact it is almost identical to the provided SSD matching function. The only difference is that the ratio test also finds the second best SSD match and then assigns the score to be the quotient of the two SSD distances.
Curves for graf
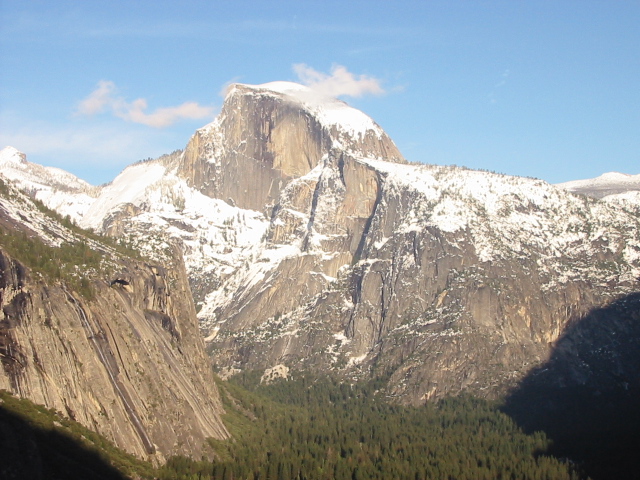
Curves for yosemite
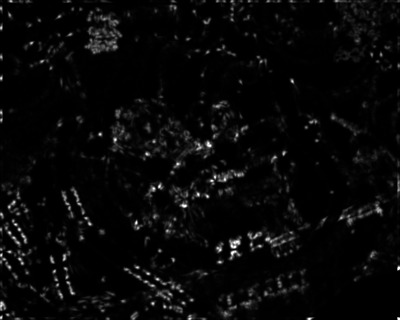
Harris for graf
Harris for yosemite

AUC values for various image sets using different descriptor and matching algorithms
| Descriptor | Match Type | leuven | bikes | wall |
|---|---|---|---|---|
| Simple | SSD | 0.246691 | 0.328771 | 0.285602 |
| Simple | Ratio | 0.521733 | 0.481730 | 0.548858 |
| MOPS | SSD | 0.551598 | 0.573592 | 0.572167 |
| MOPS | Ratio | 0.625655 | 0.574635 | 0.603268 |
The project is definitely best at finding matches which are simply translated, which makes sense since then even the simple descriptors will be almost identical between images. The MOPS descriptor does somewhat better than simple at both translation and rotation, first because it just contains a lot more image data, but also crucially because it takes into account feature orientation to allow for detecting rotated features (at least to some degree). The project is terrible at finding matches between scaled images however, since both the harris feature detector and the feature descriptors are not invariant under scaling. This also means that the descriptors are not very good at matching features between blurred images, since there is an equivalent loss of information in downsampling.