Analysis of Feature Matching:
Yosemite:
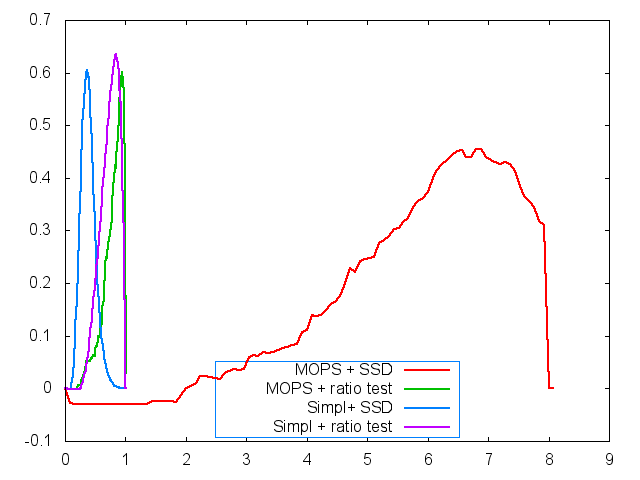
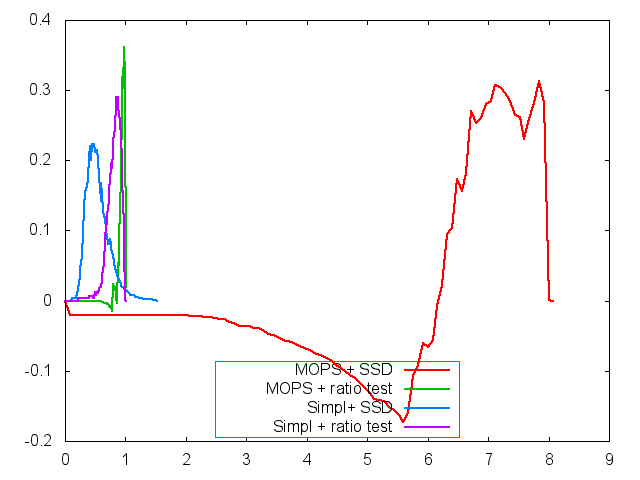
ROC CURVES THRESHOLD
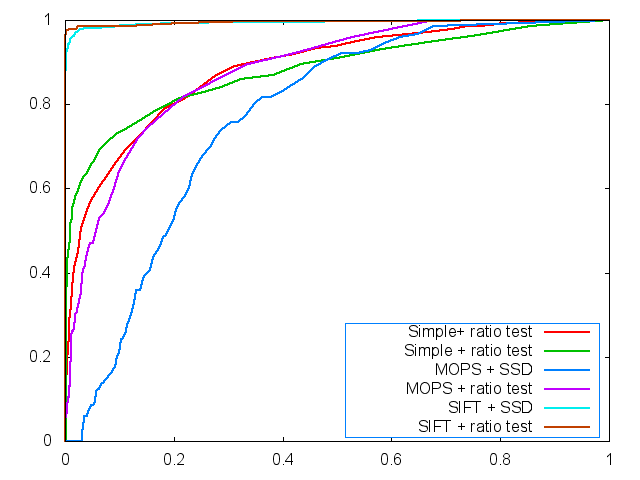
Harris Image:
AUC:
MOP SSD: 0.769033
MOP RATIO: 0.850742
SMPL SSD: 0.884203
SMPL RATIO: 0. 879848
Graffitti
ROC CURVE THRESHOLD
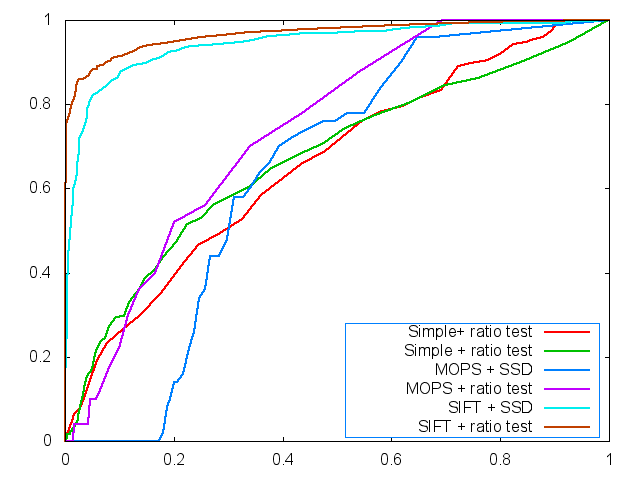
Harris Image
AUC Curves:
MOP SSD: 0.638991
MOP Ratio: 0.718483
Simp SSD: 0.657619
SimpRatio: 0.670539
We see that the simple descriptors perform better when the transformation is majorly one of translation. However, the performance dips down when the images are oriented, as seen with graffiti. SIFT features, however, are much better than both. It does orientation much better than MOPs and is probably able to give a much more unique descriptor to each of the features. On the other hand, simple descriptors are not invariant as we saw with the graffiti. On the other hand, MOPs was not able to perform as well as SIFT on either and simple on Yosemite.
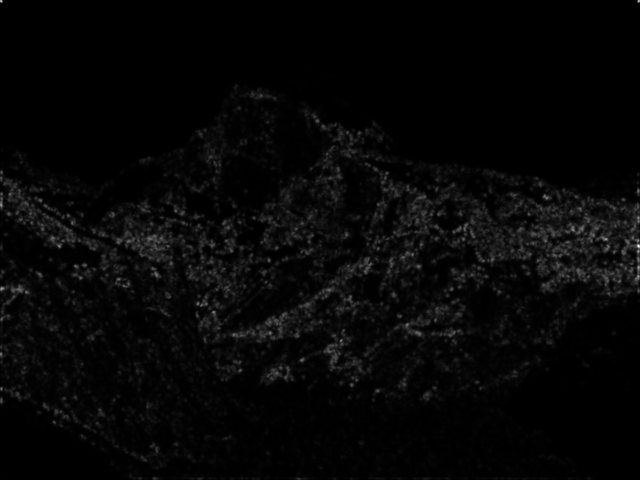
Other photos:
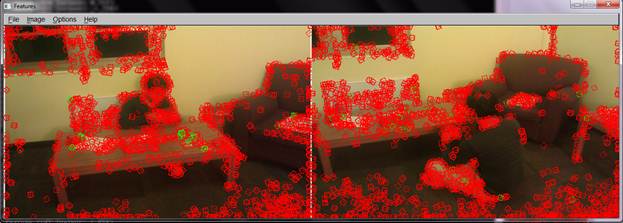
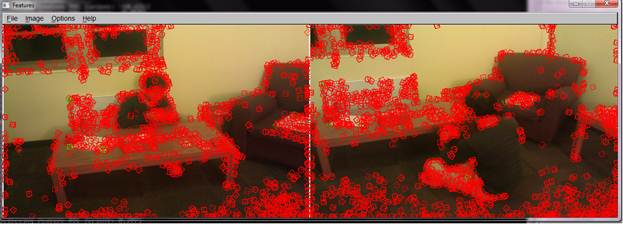
We also did basic matching on preexisting photos as well. The above are SSD and
ratio matches respectively
Major Design Choices:
The biggest design choice was in how we set the value for
the threshold. Instead of a pure numerical answer, we intended to use only 5%
of all of the total Harris Corners. The reason for doing so is for the edge
cases when we have a very round object with terrible Harris corners all around;
if we picked a normal threshold value, we might not get any corners at all.
Therefore, choosing the top %5 corners was done.