
Lab 4: Address Sanitizer & GDB
Instructions:
Remember, all assignments in CS 3410 are individual.
You must submit work that is 100% your own.
Remember to ask for help from the CS 3410 staff in office hours or on Ed!
If you discuss the assignment with anyone else, be careful not to share your actual work, and include an acknowledgment of the discussion in a collaboration.txt file along with your submission.
The assignment is due via Gradescope at 11:59pm on the due date indicated on the schedule.
- ASIDE: Working with Docker + QEMU + GDB
- Getting Started
- Part 1: Memory Bugs in
sel_sort.c - Part 2: Logic Bugs in Selection Sort
- Part 3:
meal_countProblems (Optional)
In this lab we will introduce two tools for debugging C code - AddressSanitizer (ASan) and the GNU Debugger (GDB). ASan is useful for catching many common memory bugs. GDB allows you to step through your code one line at a time, with the ability to see values of variables along the way.
In this lab, you are given two programs, sel_sort.c and meal_count.c, each one containing multiple bugs. Your job is to find these bugs, using the capabilities of GDB and ASan.
To get credit for this lab you must follow along and complete the gradescope lab 4 assignment.
ASIDE: Working with Docker + QEMU + GDB
As with other assignments in this course, you should carry out all of your work within the Docker container that is distributed as part of the course infrastructure. The combination of Docker, QEMU, and GDB appears in several real-world applications (for example, kernel debugging), so beyond the standardization it offers for our class assignments, being able to use GDB in this way will turn out to be a useful skill for you.
However, the combination of these three adds some additional complexity to the use of GDB:
-
Because it needs to work at the level of the target machine’s ISA (i.e., RISC-V), you can’t just run a compiled program directly with GDB. Instead, you will need to use GDB’s remote-connection facility.
-
The remote-connection facility requires that you have two open terminal windows: one for the executable being run under QEMU and the other for GDB to connect to that process. Unfortunately, the fact that we are running QEMU in a Docker container adds even more complication:
- Because you are running everything in a Docker container, you need to make sure that both terminal windows are invoking the exact same container instance.
Adding Debugging Support To The CS3410 Container
The CS3410 course infrastructure document suggests that you define an alias (or, on Windows, an equivalent PowerShell function):
alias rv='docker run -i --init -e NETID=<YOUR_NET_ID> --rm -v "$PWD":/root ghcr.io/sampsyo/cs3410-infra'
where <YOUR_NET_ID> should be replaced with your actual Cornell NetID.
We’ll use this as the basis for an invocation that adds two additional pieces of functionality, control of the container image’s name and support for core dumps in the current working directory:
alias rv-debug='docker run -it --rm --init -e NETID=<YOUR_NET_ID> --name testing --ulimit core=-1 --mount type=bind,source="$PWD"/,target="$PWD"/ -v "$PWD":/root ghcr.io/sampsyo/cs3410-infra'
To make the alias stick around when you open a new terminal shell, you will need to add it to your shell’s configuration file. You can do this by pasting the alias at the end of your shell’s configuration file or by typing these commands in your terminal but fill in the appropriate file according to your shell.
echo "alias rv='docker run -i --init -e NETID=<YOUR_NET_ID> --rm -v "$PWD":/root ghcr.io/sampsyo/cs3410-infra'" >> ~/.bashrc
echo "alias rv-debug='docker run -it --rm --init -e NETID=<YOUR_NET_ID> --name testing --ulimit core=-1 --mount type=bind,source=\"\$PWD\"/,target=\"\$PWD\"/ -v \"\$PWD\":/root ghcr.io/sampsyo/cs3410-infra'" >> ~/.bashrc
As before, you don’t really need to understand the details of Docker to use this in your work, but for the curious:
-
--name testingchanges the name of the container image to “testing”, but you can choose any other name value, so long as it begins with an upper or lowercase letter. This is useful for situations in which you need to run multiple terminal windows with access to the same container image, as you will in the next section of this assignment. -
--ulimit core=-1 --mount <etc.>enables support for core dumps, which are created when a program crashes. The specific form used here ensures that a core file is always created in the current working directory.
Like rv, you can run rv-debug with zero, one, or more arguments. With zero arguments, you’ll get a bash prompt in the Docker container itself. Any arguments that are supplied are considered to be an execution of an application within the container itself.
As before, there is a similar PowerShell function that you can define if you’re working on a Windows system:
Function rv_debug {
   if (($args.Count) -eq 0) {
      docker run -i --init --rm -e NETID=<YOUR_NET_ID> --name testing --ulimit core=-1 --mount type=bind,source="$PWD"/,target="$PWD"/ -v ${PWD}:/root ghcr.io/sampsyo/cs3410-infra
   }
   else {
      $app_args=""
      foreach ($a in $args[1..($args.count-2)) {
         $app_args = $app_args + $a + " "
      }
      $app_args = $app_args.Substring(0,$app_args.Length-1);
      docker run -i --init --rm -e NETID=<YOUR_NET_ID> --name testing --ulimit core=-1 --mount type=bind,source="$PWD"/,target="$PWD"/ -v ${PWD}:/root ghcr.io/sampsyo/cs3410-infra $args[0] $app_args
   }
}
Try adding this to the function_rv_d file in which you have already defined rv_d. As with the Linux/MacOS version, you should be able to run this just like rv_d, with or without additional arguments.
See the course infrastructure document for details on making this and the rv alias a permanent part of your working environment.
Getting Started
To get started, obtain the release code by cloning your assignment repository from GitHub:
$ git clone git@github.coecis.cornell.edu:cs3410-2025sp-student/<NETID>_gdb.git
Replace <NETID> with your NetID. All the letters in your NetID should be in lowercase.
Part 1: Memory Bugs in sel_sort.c
Now that you have the aliases setup for GDB, compile sel_sort.c using the below command:
$ rv gcc -g -std=c23 -Wall -Werror sel_sort.c -o sel_sort
And run your code:
$ rv bash # Enter the interactive rv bash shell
# qemu sel_sort
Segmentation fault (core dumped)
# Your code may also hang, in that case press ^C three times in a row to exit.
Seeing the words “Segmentation fault,” “double free,” code freezing, or print statements not printing should immediately tell you to add AddressSanitizer to your code. In later assignments, approximately half of the bugs you encounter can be solved using ASan, use it!
Now add -fsanitize=address,undefined to the compile command, like so:
$ rv gcc -g -std=c23 -Wall -fsanitize=address,undefined -Werror sel_sort.c -o sel_sort
Running your code using qemu should give you something similar to this output:
# rv qemu sel_sort
sel_sort.c:28:10: runtime error: load of misaligned address 0x000000000001 for type 'long int', which requires 8 byte alignment
0x000000000001: note: pointer points here
<memory cannot be printed>
AddressSanitizer:DEADLYSIGNAL
=================================================================
==1==ERROR: AddressSanitizer: SEGV on unknown address 0x000000000001 (pc 0x000000010eec bp 0x001555d569d0 sp 0x001555d56990 T0)
==1==The signal is caused by a READ memory access.
==1==Hint: address points to the zero page.
    #0 0x10eee in swap /root/sel_sort.c:28
    #1 0x11182 in selection_sort /root/sel_sort.c:40
    #2 0x11582 in main /root/sel_sort.c:69
    #3 0x1556ace922 in __libc_start_call_main (/lib/libc.so.6+0x2b922)
    #4 0x1556acea0e in __libc_start_main@GLIBC_2.27 (/lib/libc.so.6+0x2ba0e)
    #5 0x10bda in _start (/root/sel_sort+0x10bda)

AddressSanitizer can not provide additional info.
SUMMARY: AddressSanitizer: SEGV /root/sel_sort.c:28 in swap
==1==ABORTING
The important line to focus on here is:
#0 0x10eee in swap /root/sel_sort.c:28
It tells us that line 28 in sel_sort.c caused the segmentation fault. Can you figure out what is wrong on line 28? ASan output can be confusing at times, if you are struggling do not be afraid to ask course staff for help.
After fixing both bugs, you might notice that your code does not print the correct output. Unfortunately, ASan cannot help find logic bugs in your code. For those, GDB is needed.
Part 2: Logic Bugs in Selection Sort
Introduction
The file sel_sort.c contains an implementation of the selection sort algorithm, with a main procedure that tests it on two different arrays. A version that passes its tests will display each array in ascending order. Sadly, it does not pass. In fact, trying to run it results in an unsorted array:
# qemu sel_sort
Test array #1:
[an unsorted array]

Test array #2:
[another unsorted array]
First, lets get GDB set up for your sel_sort.c.
Building Source Files for Debugging
In order to debug a program with GDB, you must first compile its source code with debugging symbols that allow GDB to inspect the resulting executable and display information such as program execution and variable values in terms of the original C code. To do this, compile the source file with the additional -g flag. This flag will add debugging symbols to the executable that will allow GDB to debug much more effectively.
Unlike previous assignments, we will often recommend here that you execute commands within a running CS3410 container, instead of using rv (or rv-debug/rv_ddebug) to run each command as a standalone process.
To do this, simply type rv or rv-debug without any additional arguments. This will give you a shell prompt in the container itself, in which you can explore GDB and other utilities. For example, you can compile sel_sort.c for debugging with gdb either like this:
$ rv-debug gcc -g -std=c23 -Wall -Werror sel_sort.c -o sel_sort
or like this:
$ rv-debug
root@738c193ce5cb:~# gcc -g -std=c23 -Wall -Werror sel_sort.c -o sel_sort
To help make clear when you’re running a command in your computer’s native terminal windows versus the terminal window in the CS3410 continer, we’re including the prompts for each one in the commands you’ll type below. Those that begin with $ are prompts in your native terminal app, while prompts that look like “root@738c193ce5cb:~#” are in the container terminal shell. The 738c193ce5cb component of the prompt is the ID of the running container, so this value will likely vary between runs.
Using GDB’s Remote Debugging
To use GDB in the Docker+QEMU environment, you will need to run your application and GDB as separate processes that communicate on the same port number. Assuming you have already compiled the sel_sort.c code, here are the basic steps:
-
Open a second window in your terminal app; ideally, this will be a split view window. The details vary, but most terminal applications have this capability.
-
In one window, start a shell prompt in the CS3410 container (
rv-debug), and type the following:$ rv-debug root@fc4d619a76a4:~# qemu -g 1234 sel_sort # The fc4d619a76a4 value will vary from run to runThis will appear to hang, which is what you want. The application is now running, but QEMU is waiting on GDB to launch.
-
In the other terminal window, type the following using the value you wrote down in the previous step:
$ docker exec -it fc4d619a76a4 bash
root@fc4d619a76a4:~# gdb  -ex 'target remote localhost:1234' -ex 'set sysroot /opt/riscv/sysroot' -ex 'file /root/sel_sort' -ex 'set can-use-hw-watchpoints 0' sel_sort
You should see several lines of output, ending in a warning about changing the file. Answer “
y” to both prompts, and you’ll get the GDB prompt,(gdb):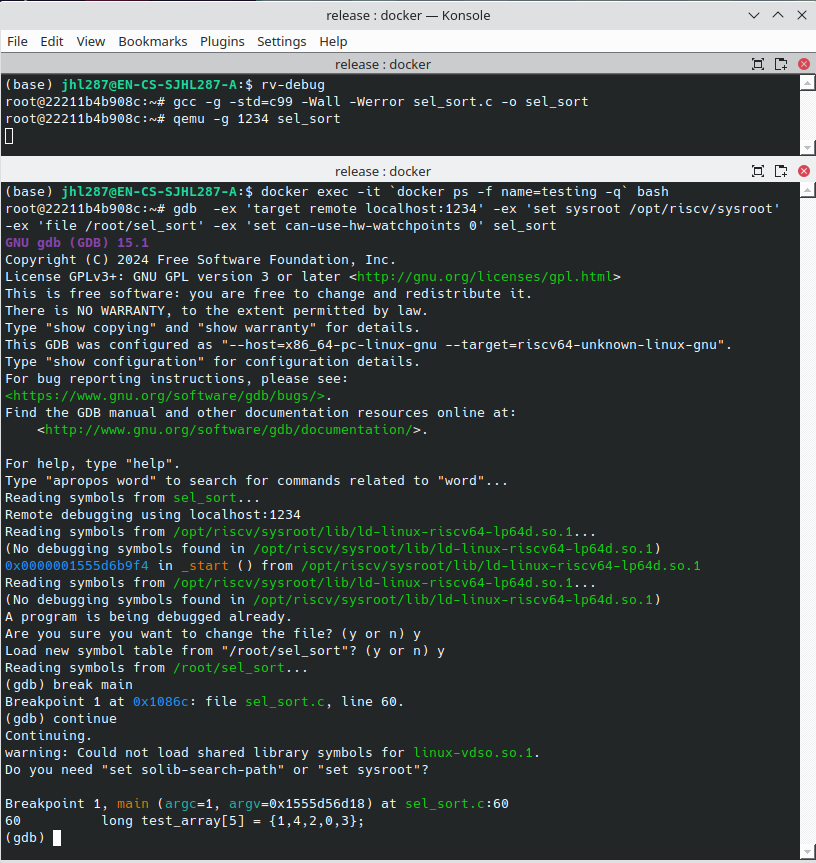
-
The
fc4d619a76a4value in thedocker execcommand is the ID of the Docker container whereexecwill run its command. This ID needs to match the ID of the container you started in Step 2. Since we defined therv-debugshortcut to include an explict container name of our choice (“--name testing”), you can avoid having to copy/paste the container ID every time by typing instead:docker exec -it `docker ps -f name=testing -q` bash -
If you were using GDB on a compiled program that was running on native rather than emulated hardware, you could just invoke GDB like this:
gdb sel_sortIf you try that with the RISCV-64 executable you just compiled, it will load GDB and give you the GDB prompt, but you won’t be able to actually run the program.
-
GDB Basics
After you entered GDB, there are different commands you can use to help you narrow down the problems. We introduce some of them briefly in the following. With the exception of run, all of these commands should work the same way, whether you’re using GDB in our CS3410 container or natively.
Run
In the remote debugging you’ll use for this assignment and other in the class, you won’t ever use this command (the qemu -g 1234 <etc.> is already running the program you’re debugging). In other settings, however, run is a fundamental part of the basic GDB toolbox. The command runs your program until a breakpoint or crash is encountered. If you are not using GDB remotely, run is the command you would type to begin execution of your program. You can also pause your program by pressing Control-C (useful for finding infinite loops). When one of these is encountered, you will be able to inspect the state of your program with any of the commands below.
Breakpoints, next, step, continue, finish
If we want to stop and see what is going on at a particular point in our program, we can use breakpoints. To
do this in GDB, type break, followed by the line number of the source code file where you want to stop. For
example, break 64 will set a breakpoint at the beginning of the main in sel_sort.c (i.e. on Line
64). If you want to set a breakpoint at the entry to a procedure, without reference to a line number, you can
type break <procedure name> instead.
If the program is already running but paused, continue will resume execution. It will stop at the next
breakpoint if there is one, and run to the end, otherwise. If you only want to run to the end of the current procedure, you can use the finish command instead.
After the program stops at a breakpoint, you can use either next or step to execute the program line
by line.
(The difference between them is that next will skip over execution of the body of a called procedure and just go to the instruction after the procedure returns, while step will pause at the first instruction of the procedure body.)
(gdb) break main
Breakpoint 1 at 0x10860: file sel_sort.c, line 60.
(gdb) continue
Continuing.
warning: Could not load shared library symbols for linux-vdso.so.1.
Do you need "set solib-search-path" or "set sysroot"?

Breakpoint 1, main (argc=1, argv=0x1555d56d18) at sel_sort.c:60
60          long test_array[5] = {1,4,2,0,3};
(gdb) continue
Continuing.
[Inferior 1 (process 9) exited normally]
If the program you are debugging closes or crashes, you will need to restart the remote debuggin process: exit GDB, restart your program with QEMU waiting on GDB, then re-launch GDB in the other terminal window.
Disable/delete breakpoints
Use the delete <N> command to delete breakpoint N, or disable <N> if you only want to disable it. It reverse, enable N , is used to enable breakpoint N. Typing either delete or disable with no arguments will delete/disable all breakpoints at once.
Backtrace
When GDB reaches an error or a breakpoint it will only tell you the line of code that it occurred on. In order to see the whole
backtrace, the whole set of stack frames associated with the file at the time, type backtrace. Use this to
find the function that called the function. sel_sort.c:<line number> tells you the file and
line number of the instruction that was running when the breakpoint was triggered.
(gdb) break swap
Breakpoint 1 at 0x106b8: file sel_sort.c, line 28.
(gdb) continue
Continuing.
Breakpoint 1, swap (a=0x1555d56b58, b=0x1555d56b70) at sel_sort.c:28
28          long tmp = *a;
(gdb) backtrace
#0  swap (a=0x1555d56b58, b=0x1555d56b70) at sel_sort.c:28
#1  0x000000000001077c in selection_sort (arr=0x1555d56b58, len=5) at sel_sort.c:40
#2  0x00000000000108c4 in main (argc=1, argv=0x1555d56d18) at sel_sort.c:69
This gives the state of the call stack and program execution point at the moment that the breakpoint was triggered. This output tells us that the last instruction to run was line 28 of a call to swap, which itself was called on line 42 of selection_sort, and so on.
While having this much information about the call stack is helpful, we will often want to have a more detailed view of what’s going on in the program. We can see the value of any variable that is in scope in the current stack frame by using the commands print and display. These instructions print the value of any expression that is semantically valid at the current line of execution; in particular, they are useful for seeing the current values of declared variables. The difference between them is that display will show the value of its expresion argument after every instruction step, while print displays it just once.
Breakpoint 1, selection_sort (arr=0x1555d56b58, len=5) at sel_sort.c:38
38          for (int i = 0; i < len; i++)
(gdb) print (i < len)
$1 = 1
(gdb) print a
No symbol "a" in current context.
(gdb) display i
1: i = 0
(gdb) step
39              int swap_idx = smallest_idx(&arr[i], len - i);
1: i = 0
(gdb) display (i < len)
2: (i < len) = 1
(gdb) s
smallest_idx (arr=0x1555d56b58, len=5) at sel_sort.c:10
10          int smallest_i = 0;
Notice how the displays fof both i and (i < len) cease when execution steps into the body of smallest_idx.
Once smallest_idx returns, the display of these expressions will resume. You can cancel an ongoing fdisplay with undisplay.
(gdb) finish
Run till exit from #0  smallest_idx (arr=0x1555d56b58, len=5) at sel_sort.c:13
0x0000000000010748 in selection_sort (arr=0x1555d56b58, len=5) at sel_sort.c:39
39              int swap_idx = smallest_idx(&arr[i], len - i);
1: i = 0
2: (i < len) = 1
Value returned is $3 = 3
(gdb) undisplay 2
(gdb) s
42              swap((long *)arr[i], (long *)arr[swap_idx]);
1: i = 0
(gdb)
Finally, a related command, x, gives a more low-level version of this same feature by showing the contents of memory at a given address. See https://visualgdb.com/gdbreference/commands/x, among other resources, for a detailed explanation.
Info
The info command provides brief summaries of important program information:
info locals—displays the values of every local variable in the current stack frameinfo args—displays the values of every parameter in the current stack frameinfo stack—displays the current call stackinfo break—displays all currently-defined breakpoints, whether they are enabled or not.
Some Advanced GDB Feautures: Watchpoints And Conditional Breakpoints
Watchpoints
Watchpoints break the program execution whenever the value of an expression changes, and the value changes will be displayed. To set a new watchpoint, you need to invoke watch with either an expression or a raw memory address. If you watch an expression, it must be semantically valid for the current execution point (i.e. all variables in scope, etc.); the watchpoint will be deleted when execution leaves the block in which the expression is meaningful. To watch the contents of a memory address regardless of the program’s block structure, use the -location (or -l) flag. For example, you could set a watchpoint on index 0 of the array test_array.
Breakpoint 1, main (argc=1, argv=0x1555d56d18) at buggy_sel_sort.c:64
64          long test_array[5] = {1,4,2,0,3};
(gdb) watch test_array[0]
Watchpoint 2: test_array[0]
(gdb) watch -location test_array[0]
Watchpoint 3: -location test_array[0]
(gdb) continue
Continuing.

Watchpoint 2: test_array[0]

Old value = 0
New value = 1

Watchpoint 3: -location test_array[0]

Old value = 0
New value = 1
0x000000000001088c in main (argc=1, argv=0x1555d56d18) at buggy_sel_sort.c:64
64          long test_array[5] = {1,4,2,0,3};
(gdb) continue
Continuing.

Watchpoint 2 deleted because the program has left the block in
which its expression is valid.
(gdb) info break
Num     Type           Disp Enb Address            What
1       breakpoint     keep y   0x000000000001086c in main at buggy_sel_sort.c:64
        breakpoint already hit 1 time
3       watchpoint     keep y                      -location test_array[0]
        breakpoint already hit 1 time
4       breakpoint     keep y   0x0000000000010710 in selection_sort at buggy_sel_sort.c:38
The command info break will show watchpoints as well as breakpoints. To disable a watchpoint,
type disable <watchpoint_num>.
Conditional Breakpoints
Conditional breakpoints enable you to break execution on a line of code when an expression evaluates to true.
To set a new conditional breakpoint, type break smallest_idx is not equal to arr[0] on line 17, you can type break 17 if smallest != arr[0]. Conditional breakpoints allow you to debug specific scenarios and limit the messages that you would collect otherwise when debugging without specific conditions.
(gdb) break 17 if smallest != arr[0]
Breakpoint 1 at 0x1065c: file buggy_sel_sort.c, line 17.
(gdb) continue
Continuing.
warning: Could not load shared library symbols for linux-vdso.so.1.
Do you need "set solib-search-path" or "set sysroot"?

Breakpoint 1, smallest_idx (arr=0x1555d56b58, len=5) at buggy_sel_sort.c:17
17                  smallest_i = i;
(gdb) print smallest_idx
$1 = {int (long *, int)} 0x105f0 <smallest_idx>
Fix the Sorting
Now, use GDB to see what is causing your selection sort to fail.
Part 3: meal_count Problems (Optional)
Now let’s do the slightly harder but more interesting challenge - meal_count! This one requires you to use two new features of GDB, conditional breakpoints and watchpoints.
Wrong Orders!
A new bagel store called Computer System Bagel (CSB) just opens. Unlike CTB where you can buy bagel and coffee
separately, CSB sells them as a meal - you must buy one bagel plus one coffee! On CSB’s menu there are three
types of bagel - MIPS(#0), ARM(#1), and x86(#2) (sorry no RISC-V), and three types of coffee - HDL(#0),
C(#1), and assembly(#2). The meal_count program is used by CSB to track which bagel and coffee have the
best sale. When you run the program, it produces output like the following:
2022-10-08, Saturday      # Date
Bagel count: 510 488 2    # MIPS bagel was sold 510 times, ARM bagel 488 times, and x86 bagel 2 times.
Coffee count: 504 494 2   # HDL coffee was sold 504 times, C coffee 494 times, and assembly 2 times.
The manager thinks something is wrong with the output because neither the x86 bagel nor the assembly coffee are sold on Saturday (yes they’re too complicated to make).
Your job is to debug meal_count.c. Fortunately, there are no bugs in the program logic (let us know if you find one though …). But there are issues with the order history, like a wrong item number. The order history is stored in struct Order order_history[NUM_ORDER]. The format is {<BAGEL_NUMBER>, <COFFEE_NUMBER>}. For example, a {0, 1} means one client ordered a MIPS bagel and a C coffee.
There are two wrong orders in the order history. Please try to identify the indices (starting from 0) of these two wrong orders. For example, if the order history is {{0, 0}, {2, 1}} then the order with index 1 is invalid since #2 (x86 bagel) is not sold on Saturday. Let your TA knows the indexes when you find them!
Questions
- What are the wrong indices?
- Where are they in the source code?
- What GDB commands did you use to find them?
Hints:
- In gdb, you can use
p order_idxto print the order index. - You can easily find one wrong order using a conditional breakpoint.
- You may need a watchpoint to find the other one.
Invariants And Assertions
We hope you find the wrong indices! But the reality is that sometimes you don’t even know that your program is
misbehaving. For example, if your order history is {{4, 0}, {0, -2}}, the meal_count program generates a
totally reasonable report:
2022-10-08, Saturday
Bagel count: 1 1 0
Coffee count: 1 1 0
The report looks good, but it really isn’t, since the 4 and -2 in the order history are invalid. One thing that can help is to think about the invariants of programs and use assertions to detect any unexpected behaviors.
An assertion is a simple expression that will raise an error when its condition doesn’t hold during execution. In C, we write these as ordinary statements of the form “assert(<condition>);”, where <condition> is any boolean-valued expression. For example, you can write this in C:
#include <assert.h>
struct Queue {
  // Assume we have a Queue specification saying that when a Queue is created, it must be empty.
  //  ...
};
int isEmpty(struct Queue q) {
    return ... ;  // return 0 if not empty
}
int main() {
    struct Queue q;
    assert(isEmpty(q) != 0);  // This asserts that q must be empty.
}
Using assertions is a good way to reason about whether your program is implemented as the specification says.
For example, an ill-implemented Queue may be not be empty when it’s created. This violates the
specification and can be easily caught by the “assert(isEmpty(q) != 0)”.
Some useful cases, among any others, include (1) check whether an expected-to-be-positive int is positive
or not; (2) check whether the index to access an array is out-of-bounds.
Also, for our CSB Bagel case, both the bagel and coffee number must be 0, 1, or 2, (and on Saturdays,
either 0 or 1).
Now, try to add assertions in the meal_count program, and see whether it can catch the invalid order history.
Questions
- What is the invariant that fails here?
- What causes the failure?
- What assertion(s) did you add to detect the failure, and where did you put them?