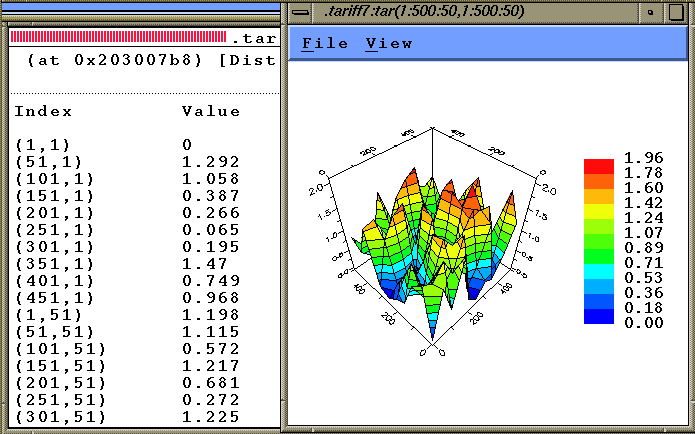
 Essentially you get a histogram of array elements by their size.
Here we are displaying a 500x500 array, every 50th element in
each direction, while debugging the HPF program.
(Here we happen to be displaying a replicated array; this is what a display of distributed data SHOULD look like. Bug in TotalView?