Fig 1: Graphical illustration of bias and variance.
Source: http://scott.fortmann-roe.com/docs/BiasVariance.html

Fig 1: Graphical illustration of bias and variance.
Source: http://scott.fortmann-roe.com/docs/BiasVariance.html

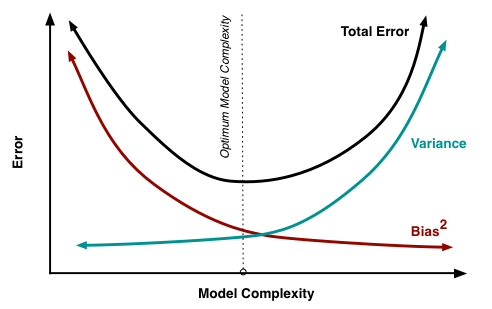
Fig 2: The variation of Bias and Variance with the model complexity. This is similar to the concept of overfitting and underfitting. More complex models overfit while the simplest models underfit.
Source: http://scott.fortmann-roe.com/docs/BiasVariance.html